Latest Infographics
Infographic
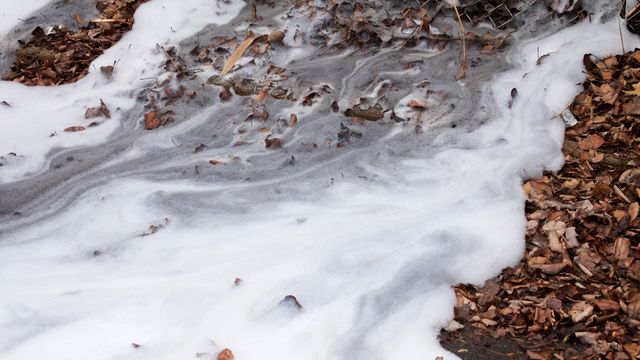
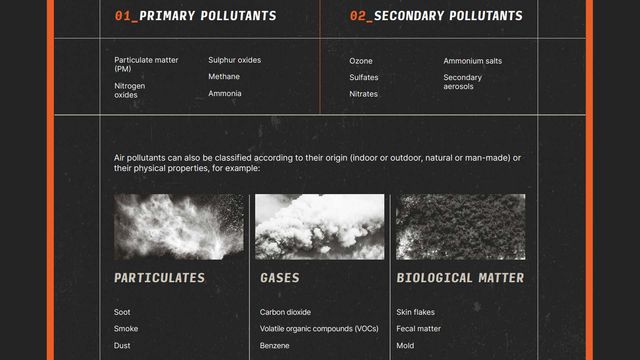
Environmental Pollutants: Air
In this infographic, we explore different types of air pollutants, sources of air pollution and key techniques used to monitor these compounds.
Infographic
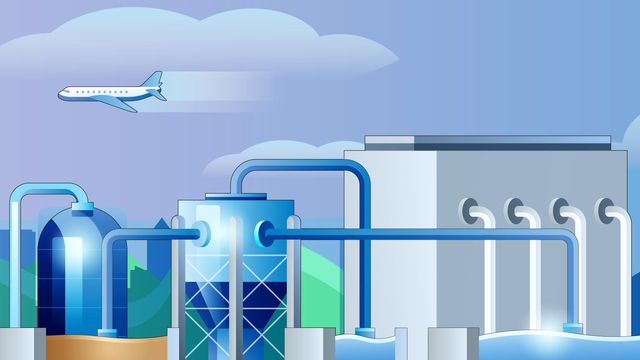
The Evolution of Wastewater-Based Epidemiology
For over 150 years, wastewater has provided a rich source of data for tracking infectious diseases and informing public health decisions. Since the COVID-19 pandemic, the scope for wastewater-based epidemiology (WBE) has increased significantly and requires increasingly rapid, versatile and accurate detection methods to monitor the spread of disease.

Infographic
Solutions for an Efficient Analysis of PFAS
Per- and polyfluorinated alkyl substances (PFAS) are used in a broad range of consumer goods. Due to their extreme stability, they accumulate in the environment and organisms, posing a significant threat to human health. Hence, proper monitoring of PFAS is required to help mitigate these harmful effects.
Infographic
Applications of Mass Spectrometry
Download this infographic to explore the diverse applications to which MS is being applied, how technique variants and hyphenation can help meet analytical needs and the capabilities of MS that make it well suited to certain analytical challenges.
Infographic
Ultraviolet-Visible Spectroscopy
Download this infographic to explore how UV-Vis spectroscopy works, what it can tell us, its strengths and limitations and its applications.
Infographic
Get SMART: Increase Your GC and GC-MS Productivity
GC-based methods are a cornerstone of many analytical and routine testing workflows. Hence, it’s important to minimize unscheduled downtime and swiftly address preventative maintenance to support workflow productivity.

Infographic
Lab Sustainability
For the future of our planet, we all know it is important to address the sustainability of our practices, tools and workspaces across the sectors. Science is no exception. But it’s also critical that, in carrying out scientific research in a more environmentally sustainable way, safety and quality are maintained.

Infographic
Achieve Faster and Smarter Gas Analysis
Based on optically enhanced Fourier-transform infrared (OE- FTIR) technology, these analyzers promise ultra-fast analysis and ultra-low detection limits without the need for sample transport.
Infographic
Food Safety Testing – Veterinary Drug Residues
This infographic addresses the issue of veterinary drug residues in foods, the dangers they pose and measures taken to detect and prevent them from reaching the consumer.
Advertisement